The mind-boggling projections speak volumes: Erling Haaland would finish the Premier League season on 39 goals if he maintains his current strike-rate and game time – and would extend that to 41 if he played every minute.
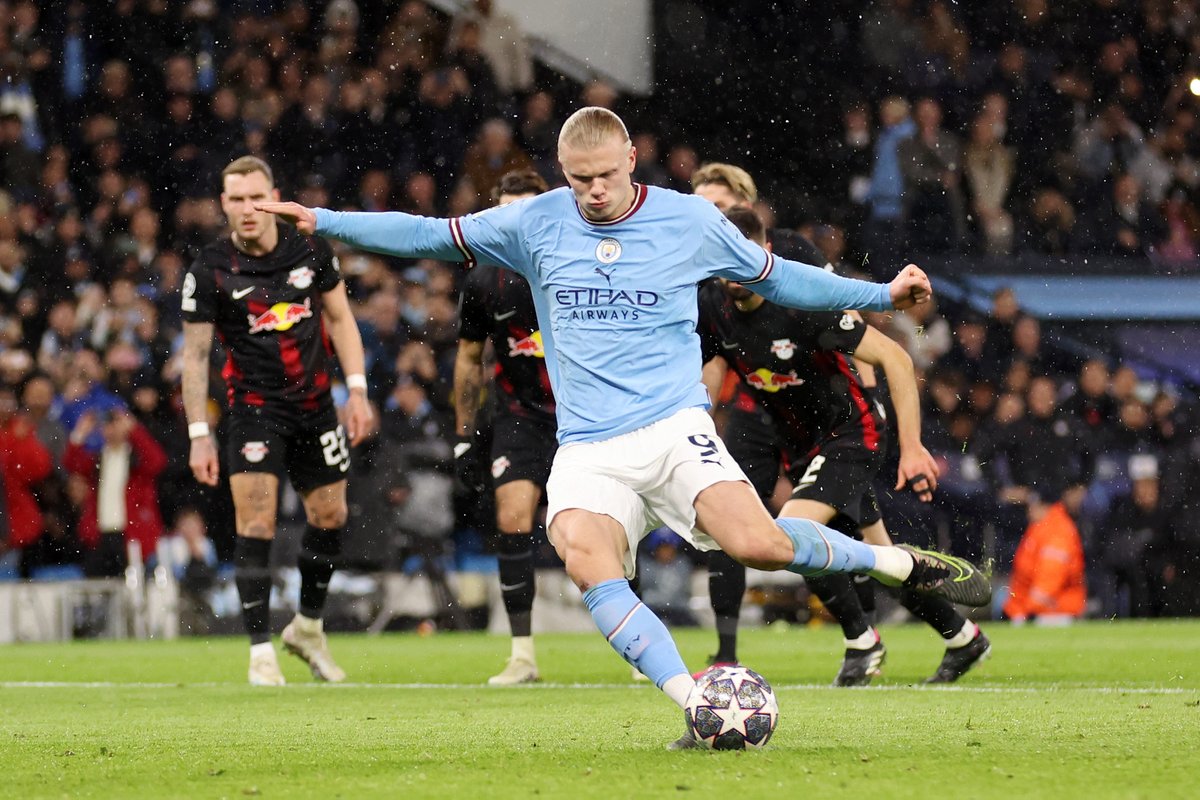
The Norwegian is on course to smash the Premier League all-time Golden Boot record of 34 set by Andy Cole (1993/94) and Alan Shearer (1994/95), both achieved in 42-game seasons.
In all competitions, Haaland would register 60 goals this term if he sustains his ratios and reaches finals in all remaining club competitions – or 66, if he was never substituted.

The 22-year-old had scored only twice in eight games leading up to late January but restored his breathtaking ratios with a penalty at Crystal Palace a fortnight ago, a five-goal haul in the 7-0 win over RB Leipzig and a hat-trick against Burnley in the FA Cup.
The striker was due to link up with the Norway national team this past week but withdrew from his country’s squad after picking up a groin injury against the Clarets.
Haaland is now “touch and go” for Manchester City’s game against Liverpool on Saturday, according to his father Alf-Inge.
So, how does Haaland score his goals and how can opponents stop him?
Hitman Haaland

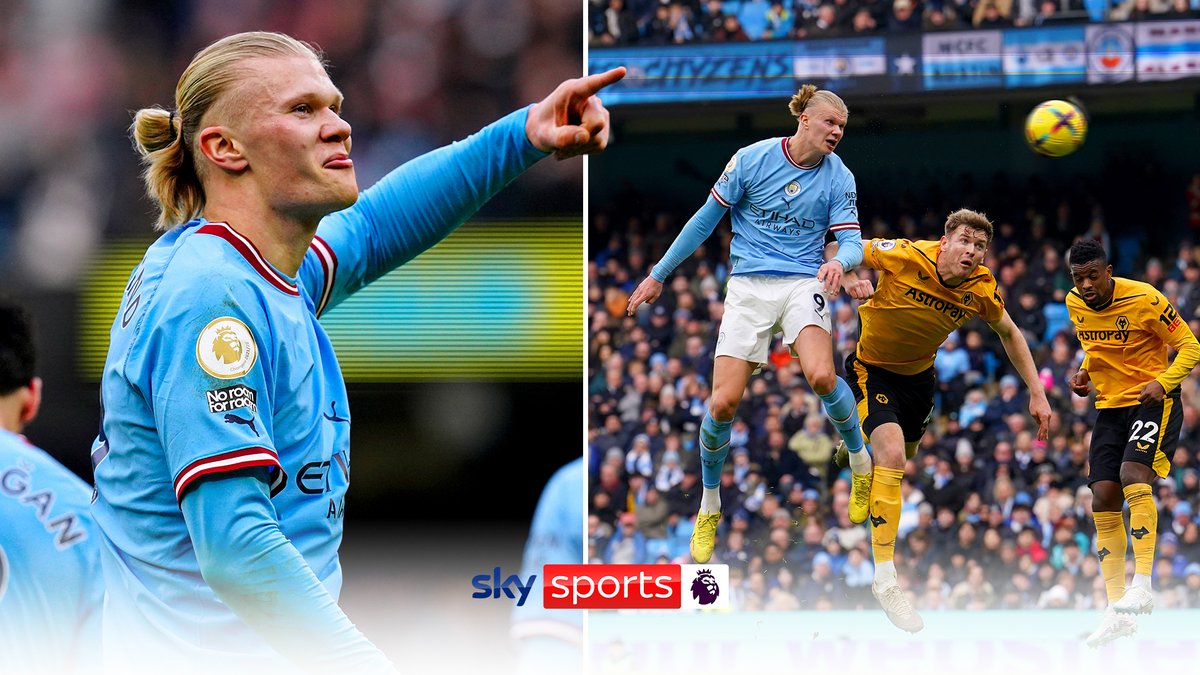
The towering frontman has netted 28 goals from just 26 Premier League games, and has also been hooked off in nine of those outings – netting four hat-tricks during wins against Crystal Palace, Nottingham Forest, Manchester United and Wolves.

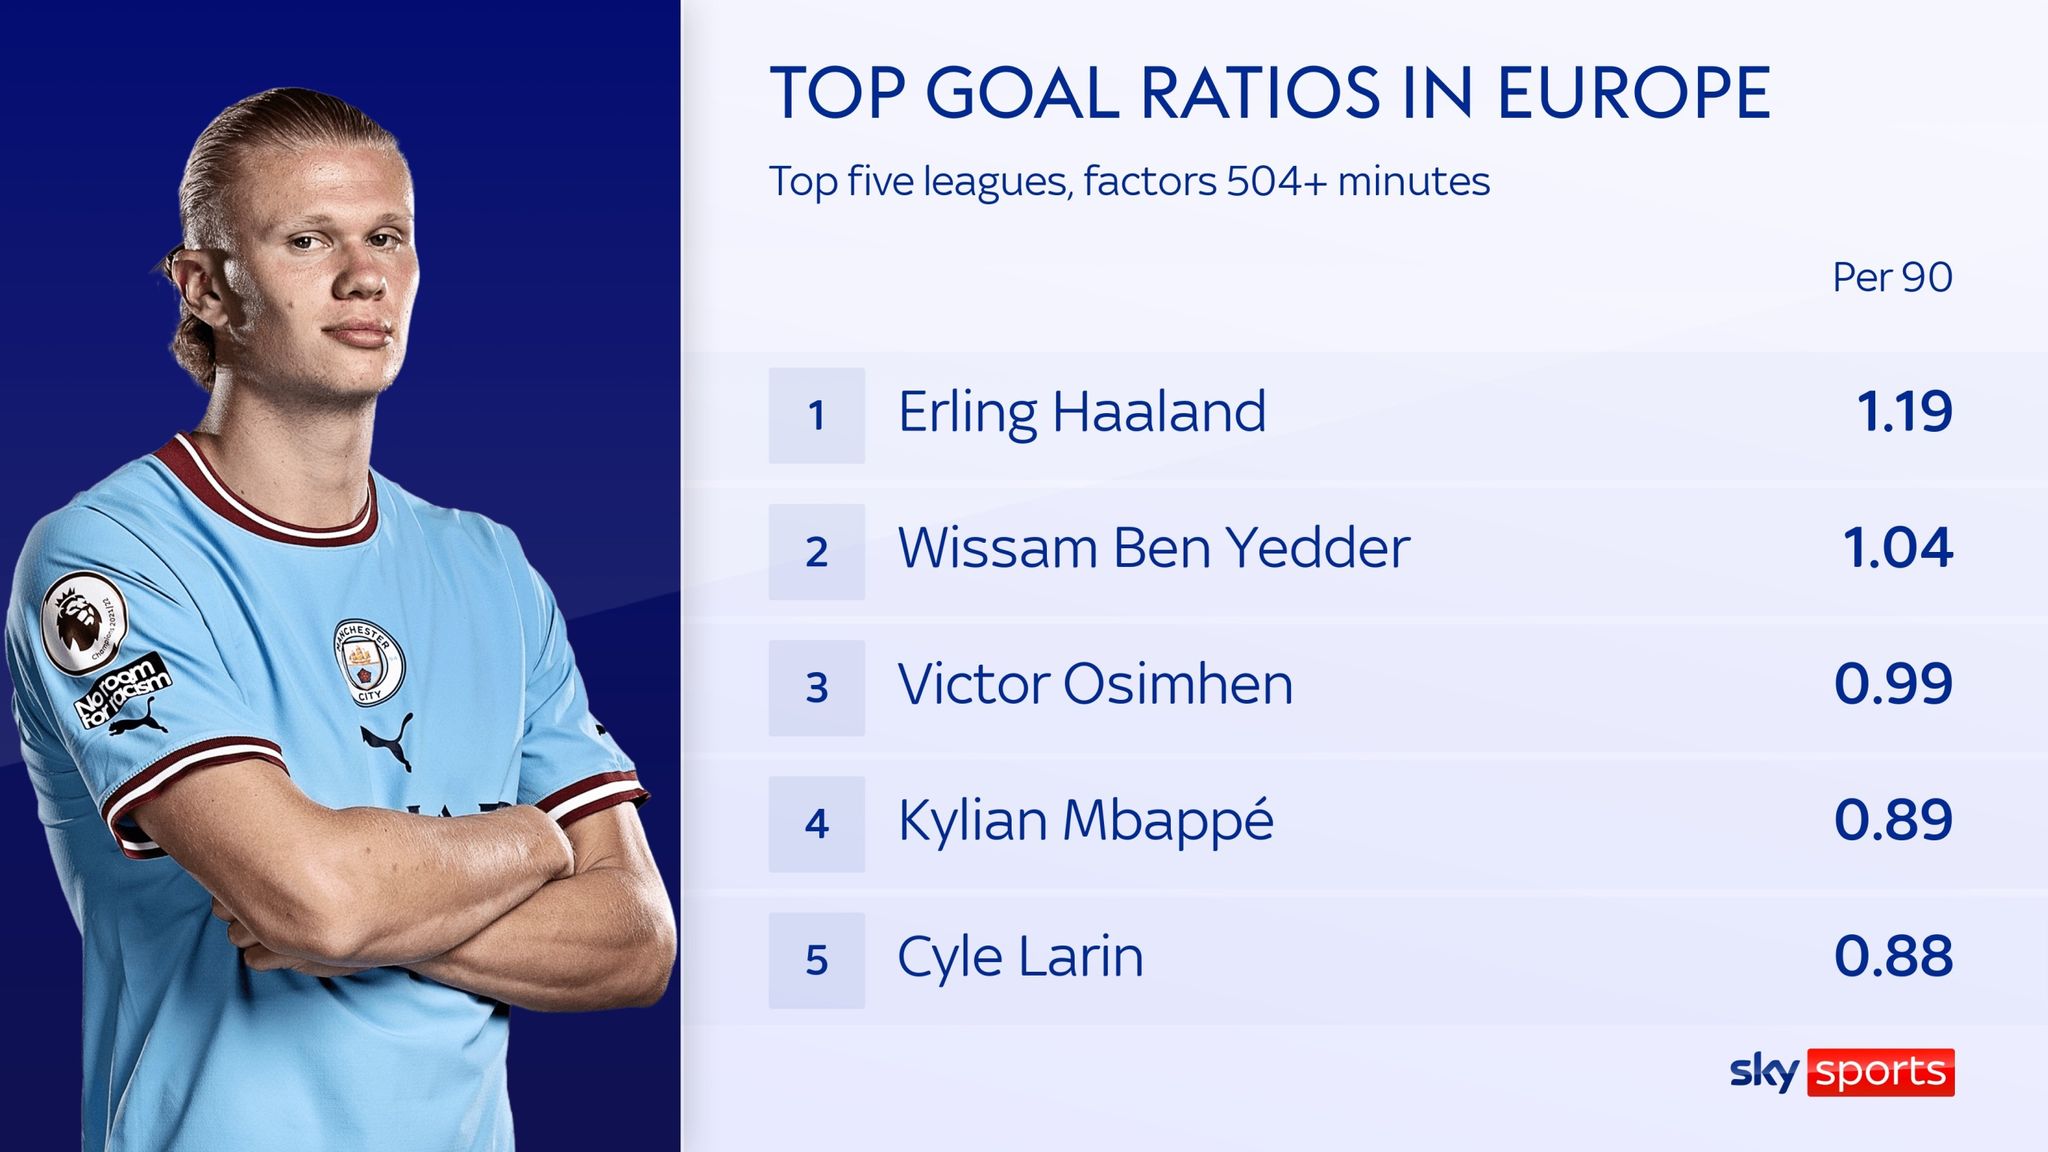
Those numbers produce a staggering league ratio of 1.19 goals per 90 minutes – more potent than any other player in Europe’s top five leagues this season to have played in excess of 504 minutes.
The chart below plots goals and expected-goal (xG) returns for all Premier League players this season and presents the scale of the striker’s achievements – soaring clear in both categories.
Several forwards from opposition teams are in consistent form, most notably Alexander Isak, Harry Kane and Ivan Toney – but Haaland is humbling his rival’s figures.

Some critics might claim any established forward would convert bags of goals in Pep Guardiola’s side, based on the sheer quantity of clear-cut chances they create.
However, the Norwegian has also outgunned his xG returns by nearly 50 per cent, netting eight goals more than the 20 expected from chances presented to him – another league-topping ratio.
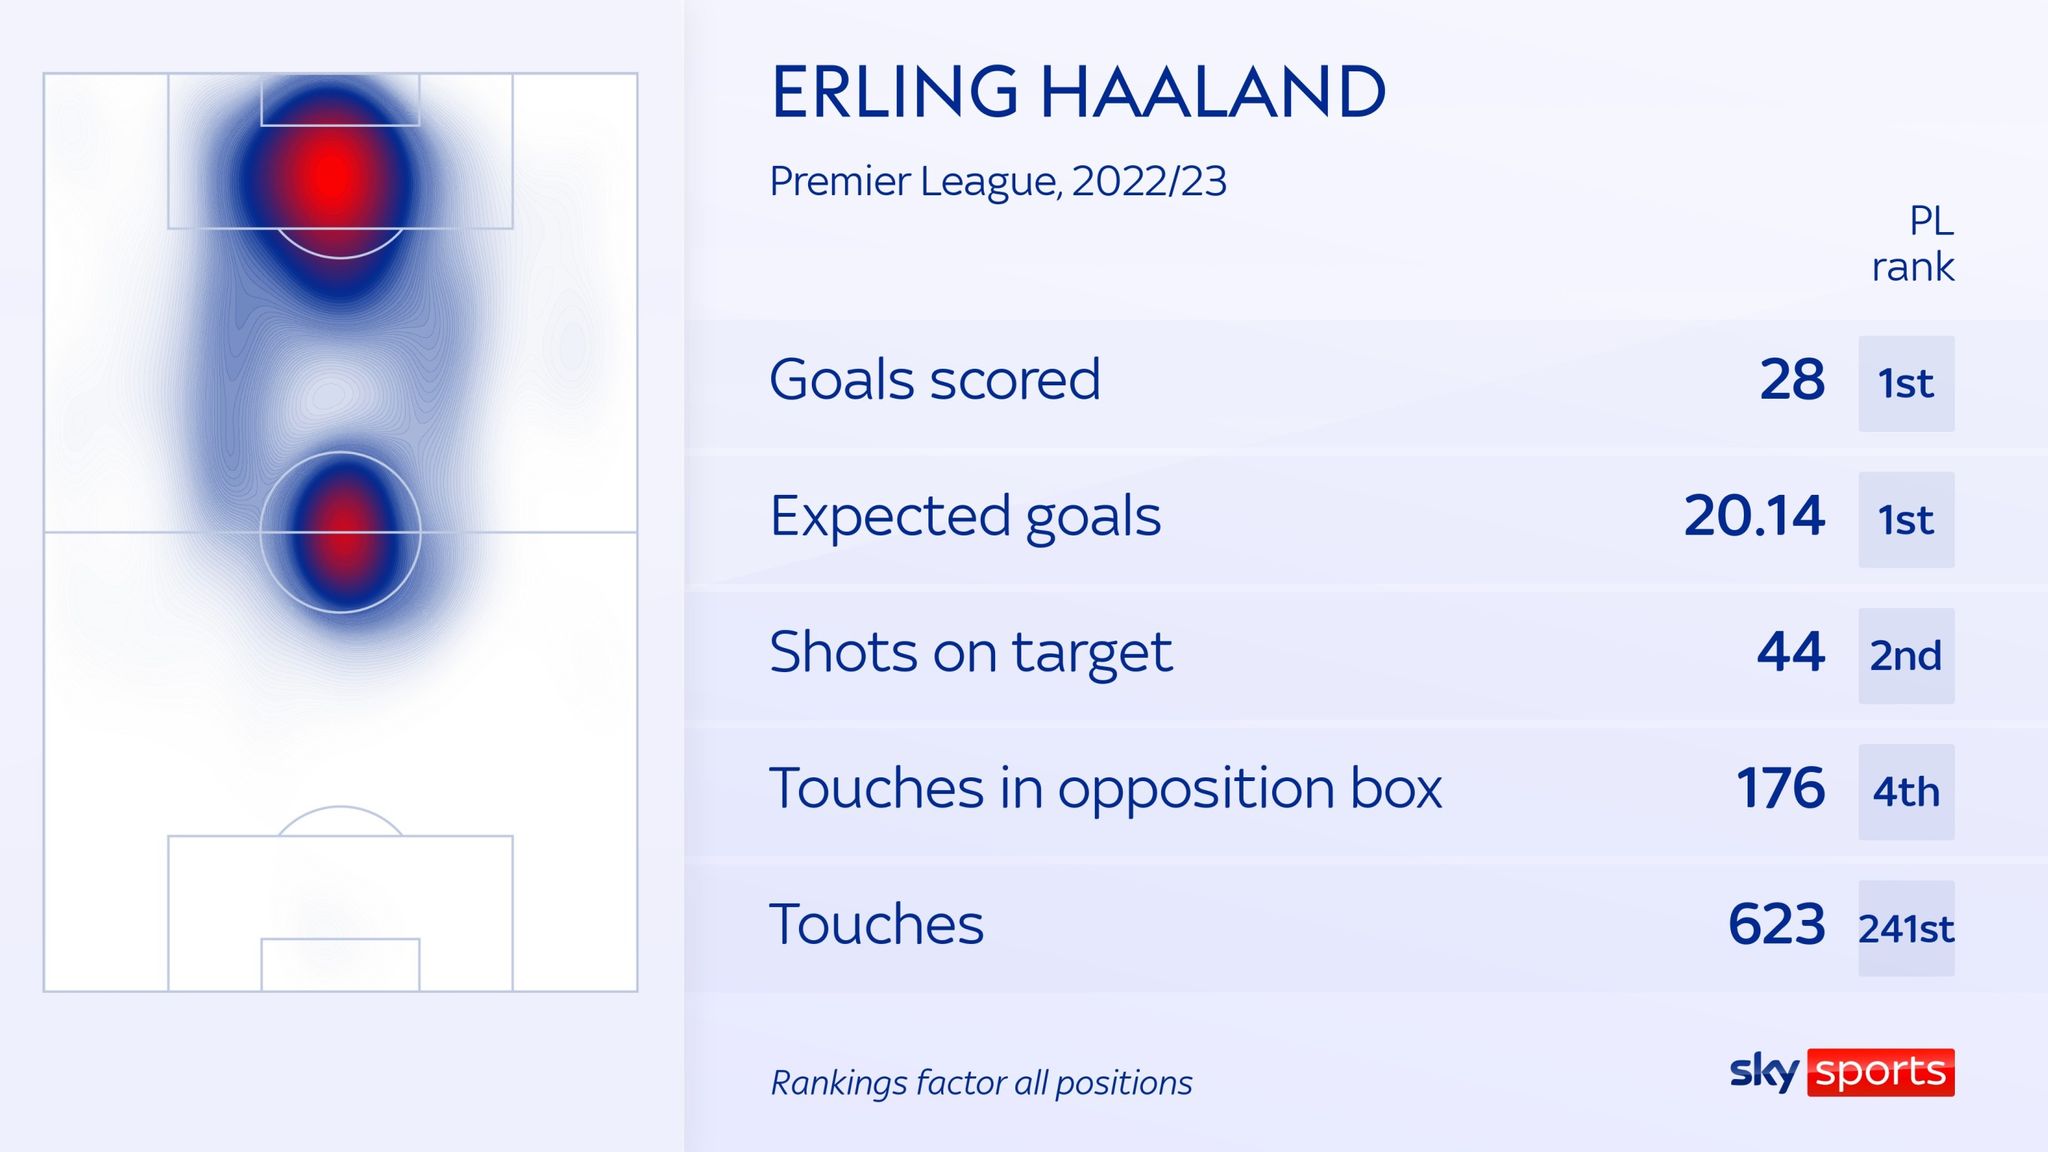
Additionally, Haaland has scored his 28 goals from only 44 shots on target, which means his current goal haul equates to one goal from every 1.6 shots on target – underlining the clinical finishing to date.
Key to stopping Haaland?
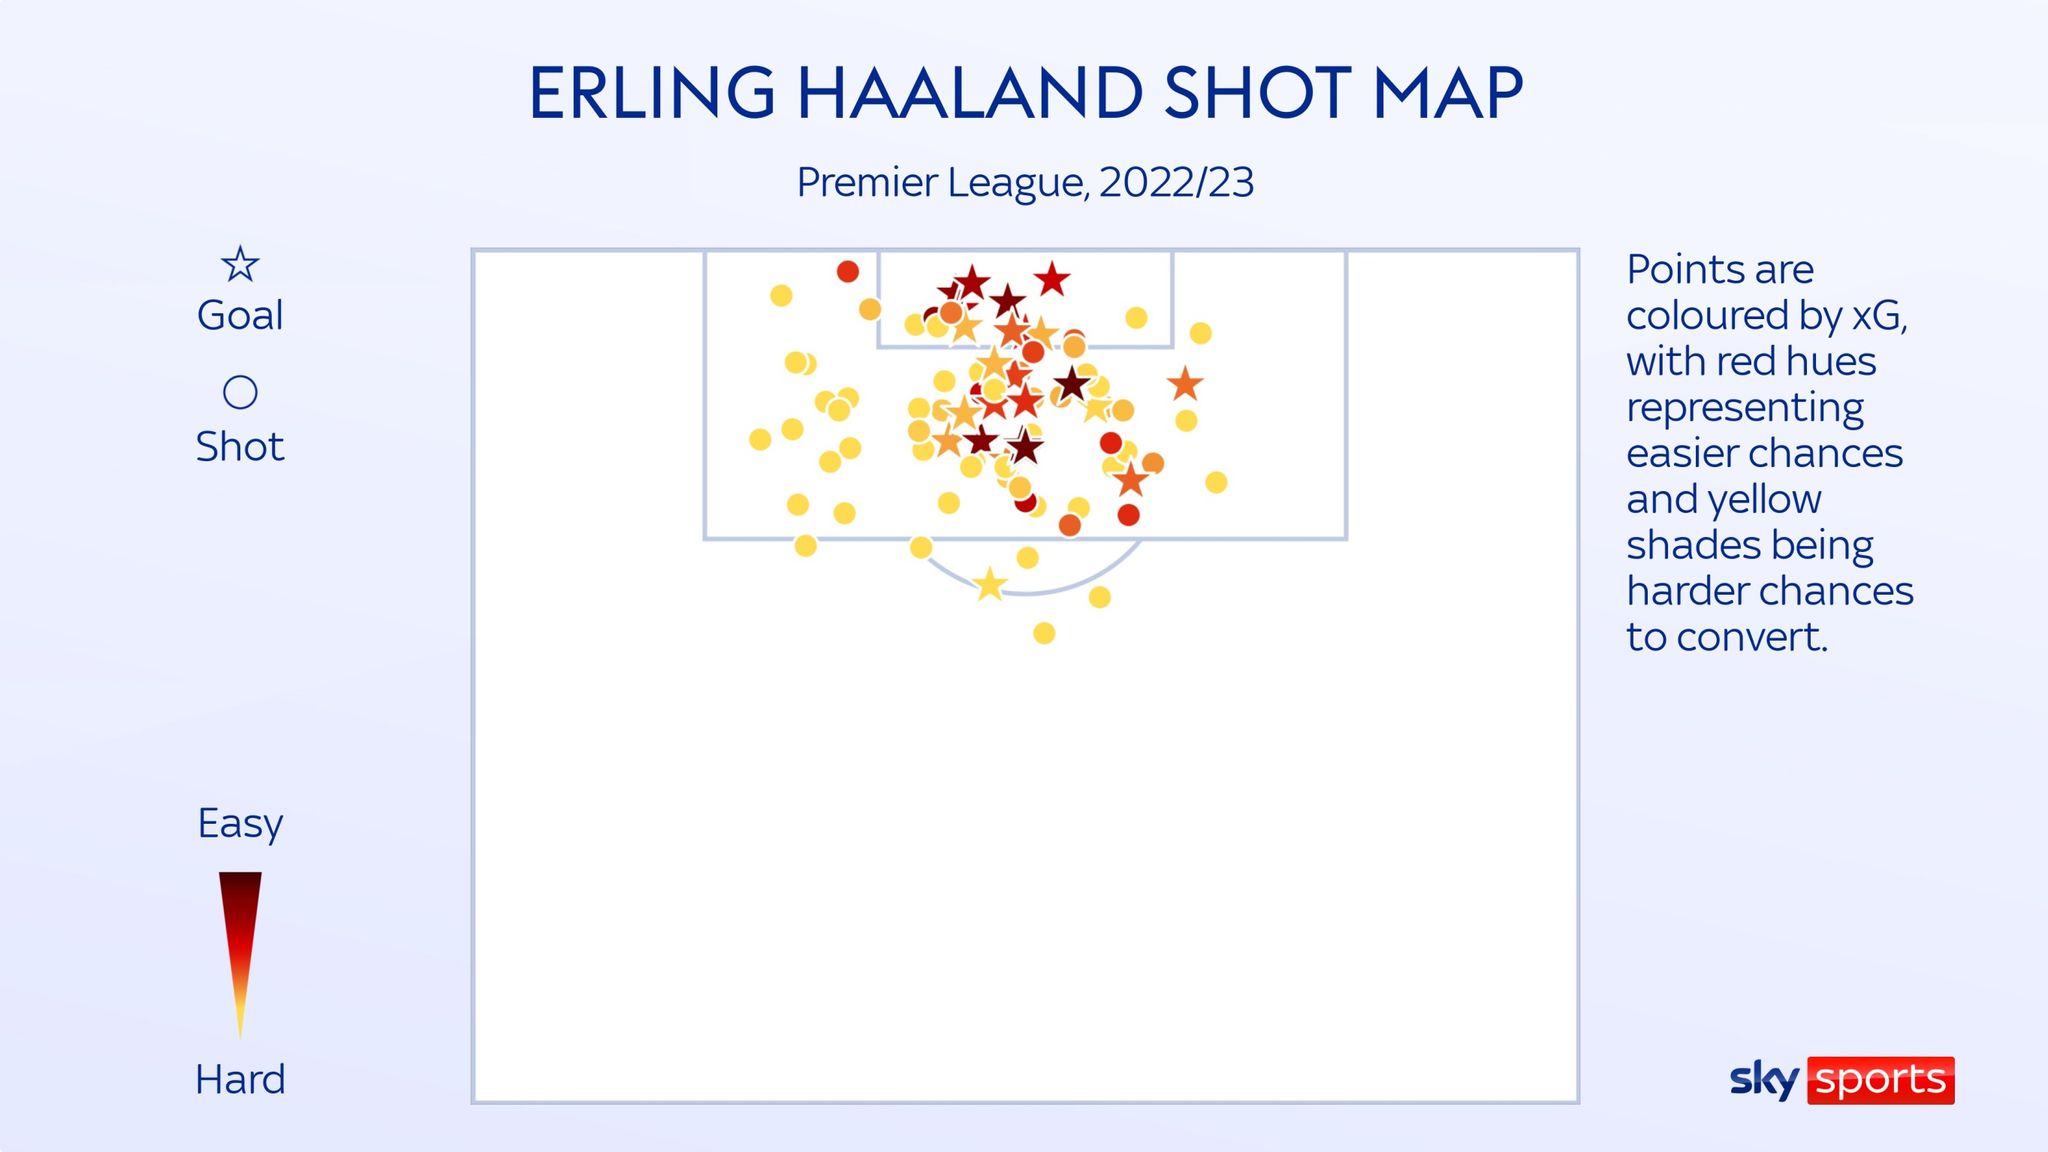
The shot map below highlights City’s No 9 has converted the lion’s share of his haul from poaching opportunities inside the six-yard box, with almost all goals fired from the central third of the opposition box.
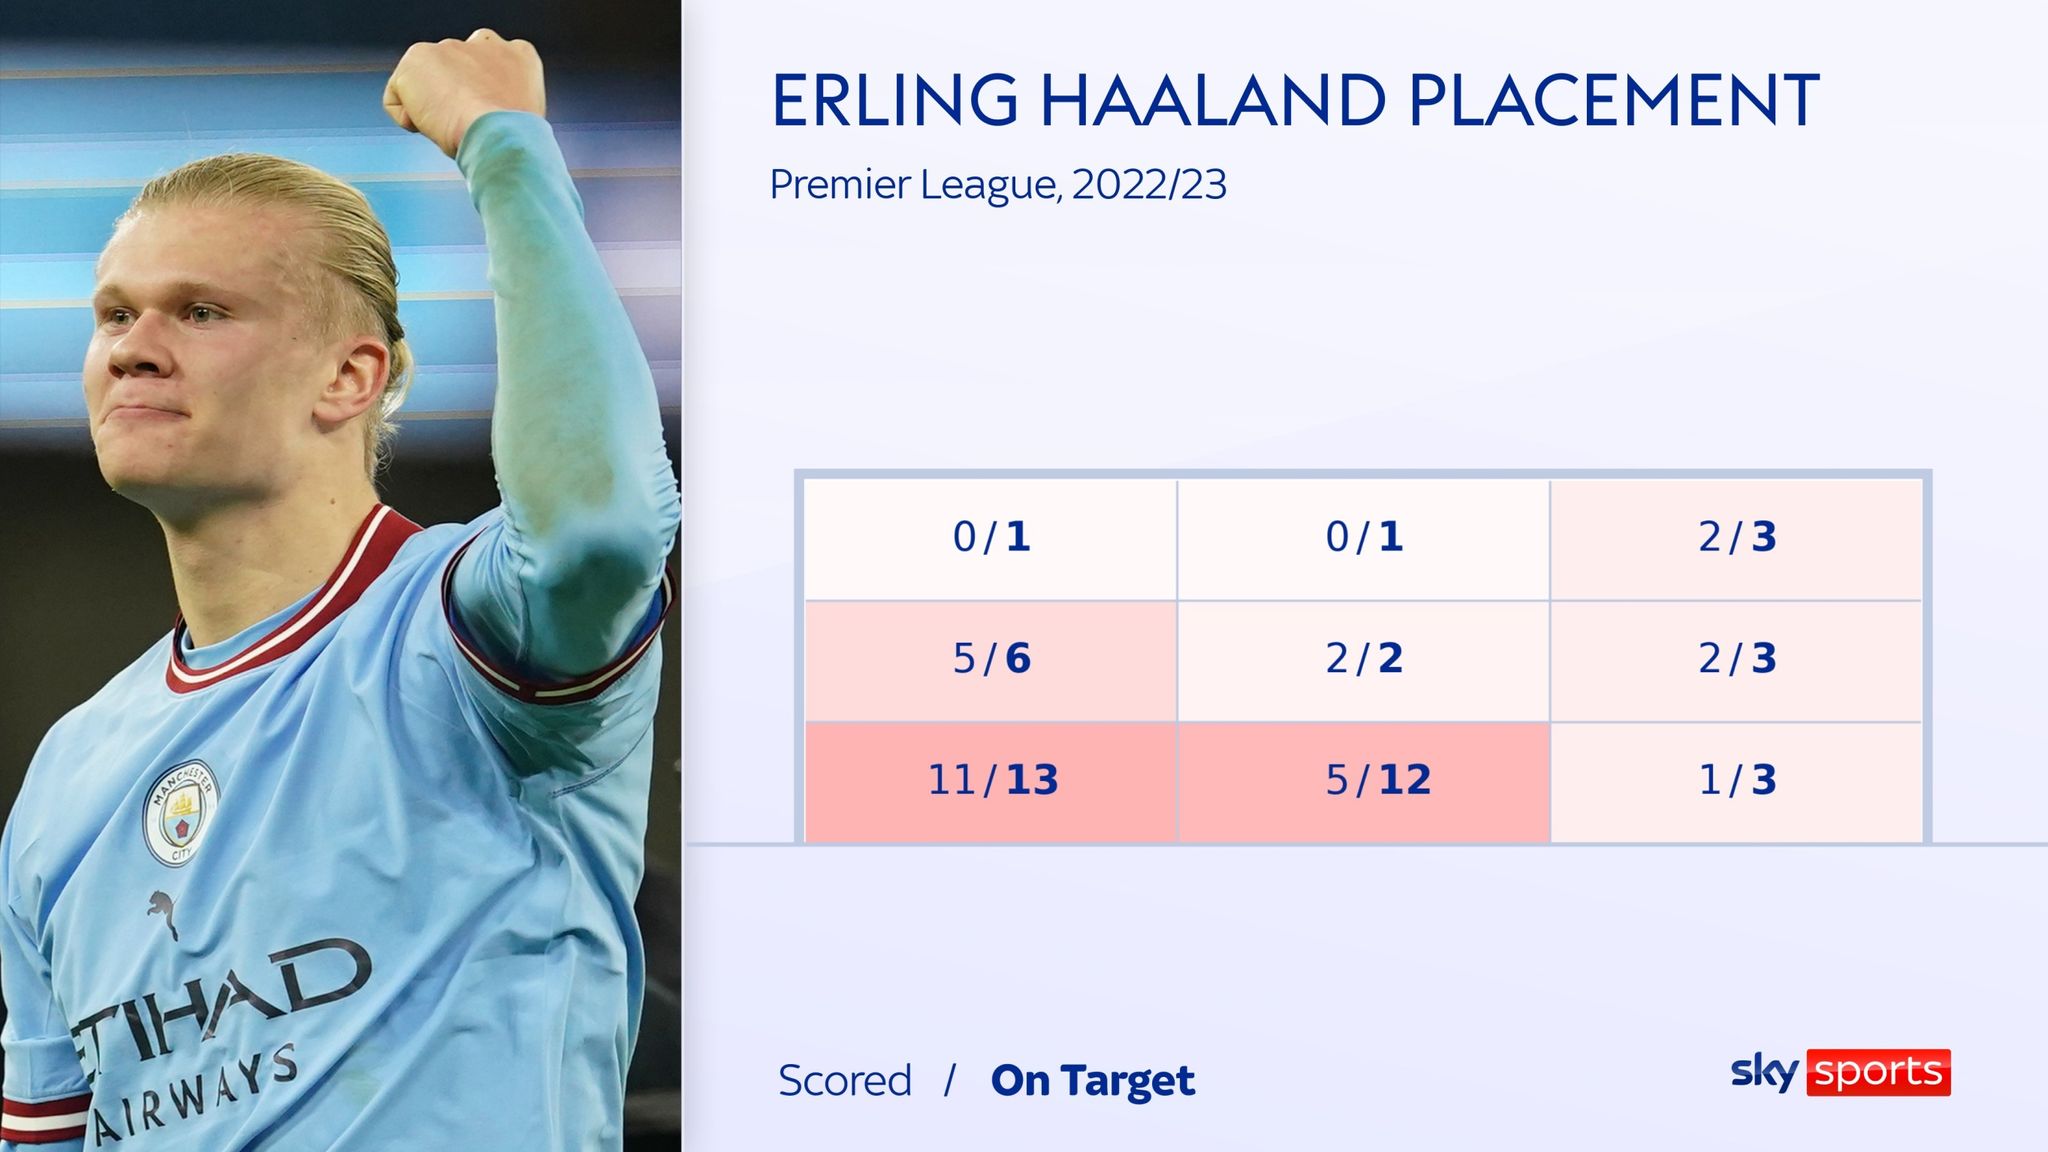
In terms of shot placement, Haaland has an almost perfect conversion rate when firing to the left side of the goal – netting 16 from 20 shots on target – and scores with around half of his attempts in the centre of the goal and to the right.
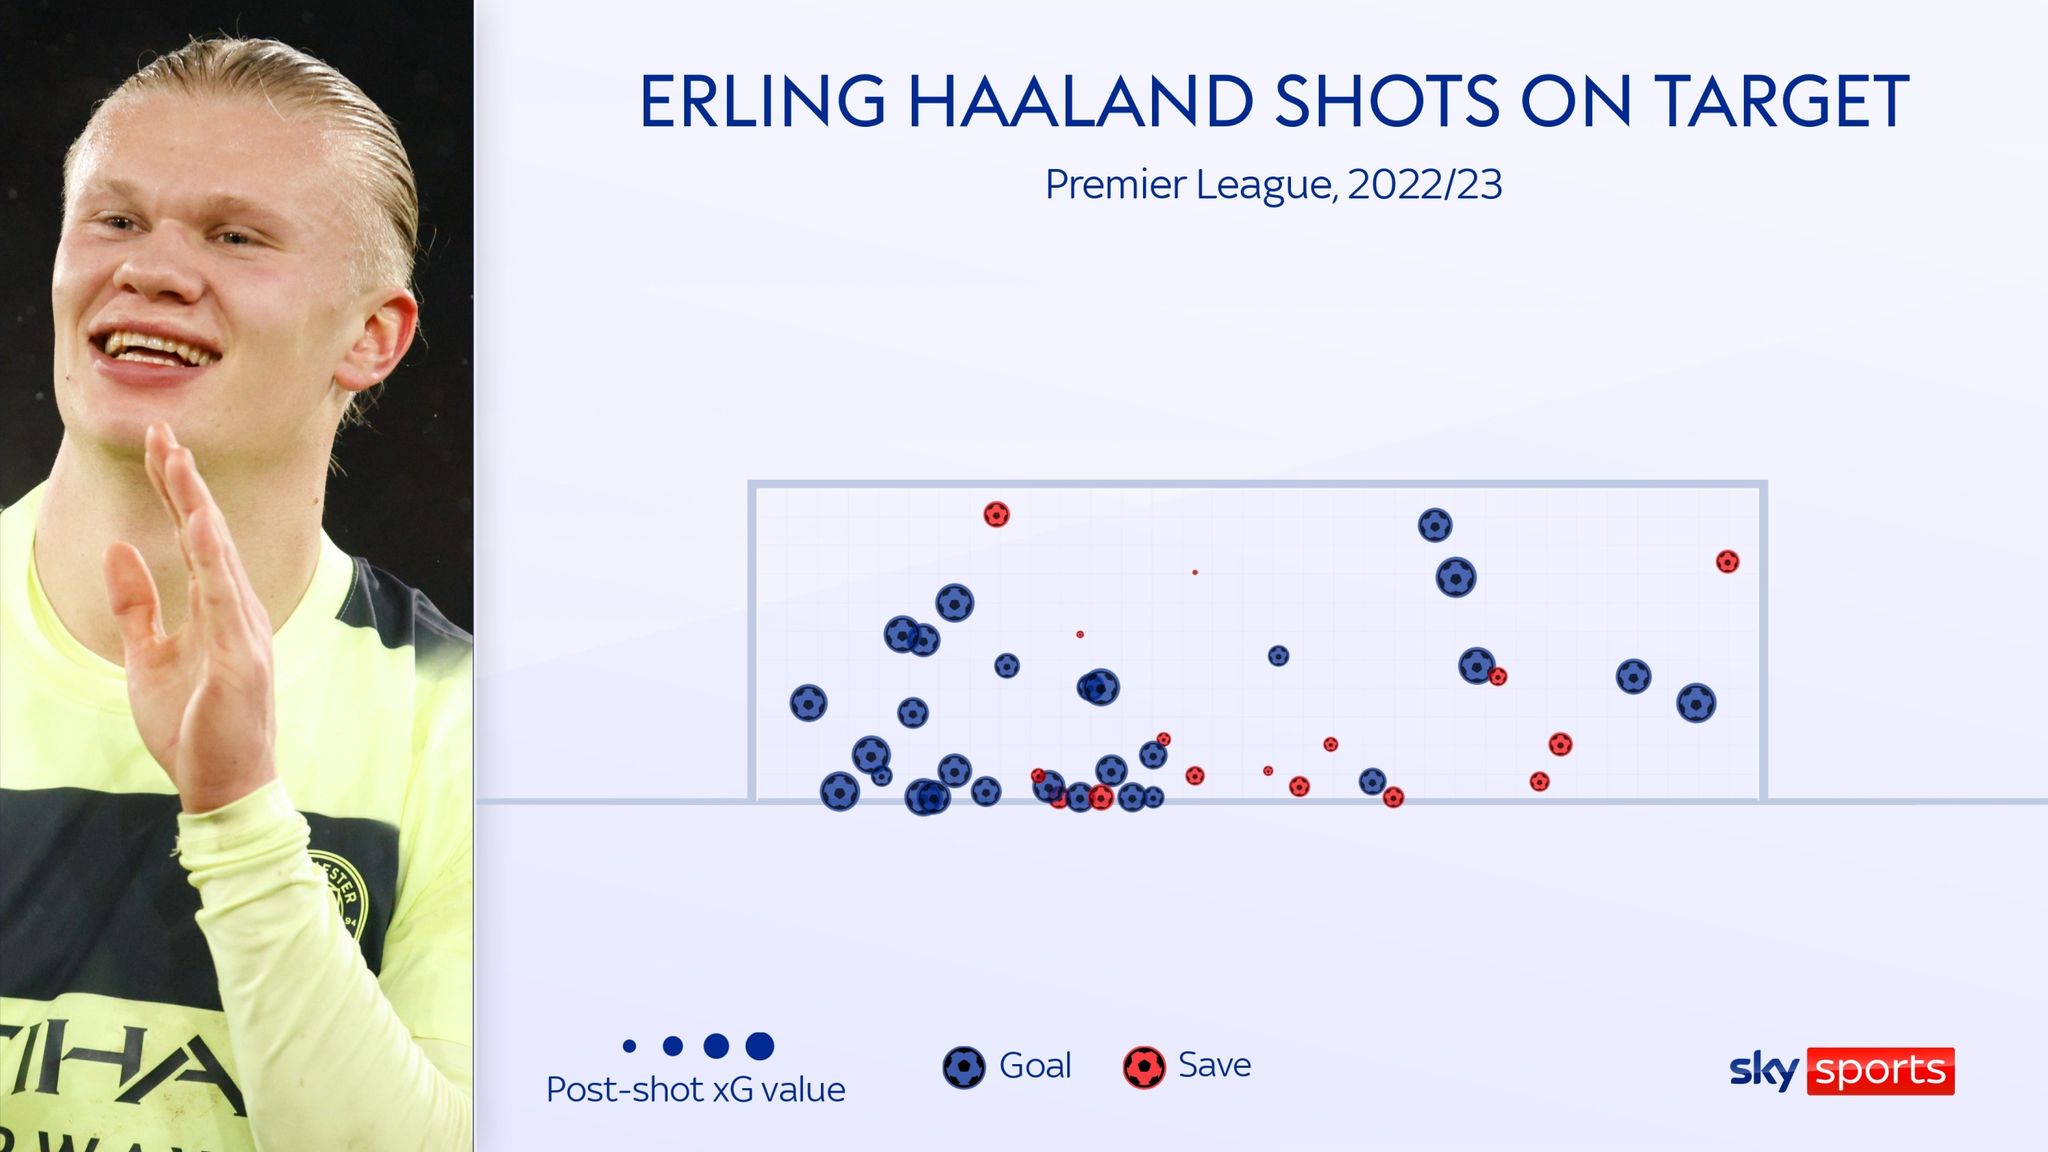
Haaland appears to be genuinely unstoppable when in full flow. His acrobatic and aerial ability, coupled with physical height, power and speed, is defying all attempts to nullify his powers – despite opponents being aware of his primary threat down the left-of-centre channel.
All-round game
The Norway international has also created five goals for team-mates but his disparity between goals and assists underlines how he typically fires on sight.

However, he averages far fewer touches, dribbles and final-third passes than other forwards – a deficiency City and most clubs would gladly trade for his prolific strike-rate.
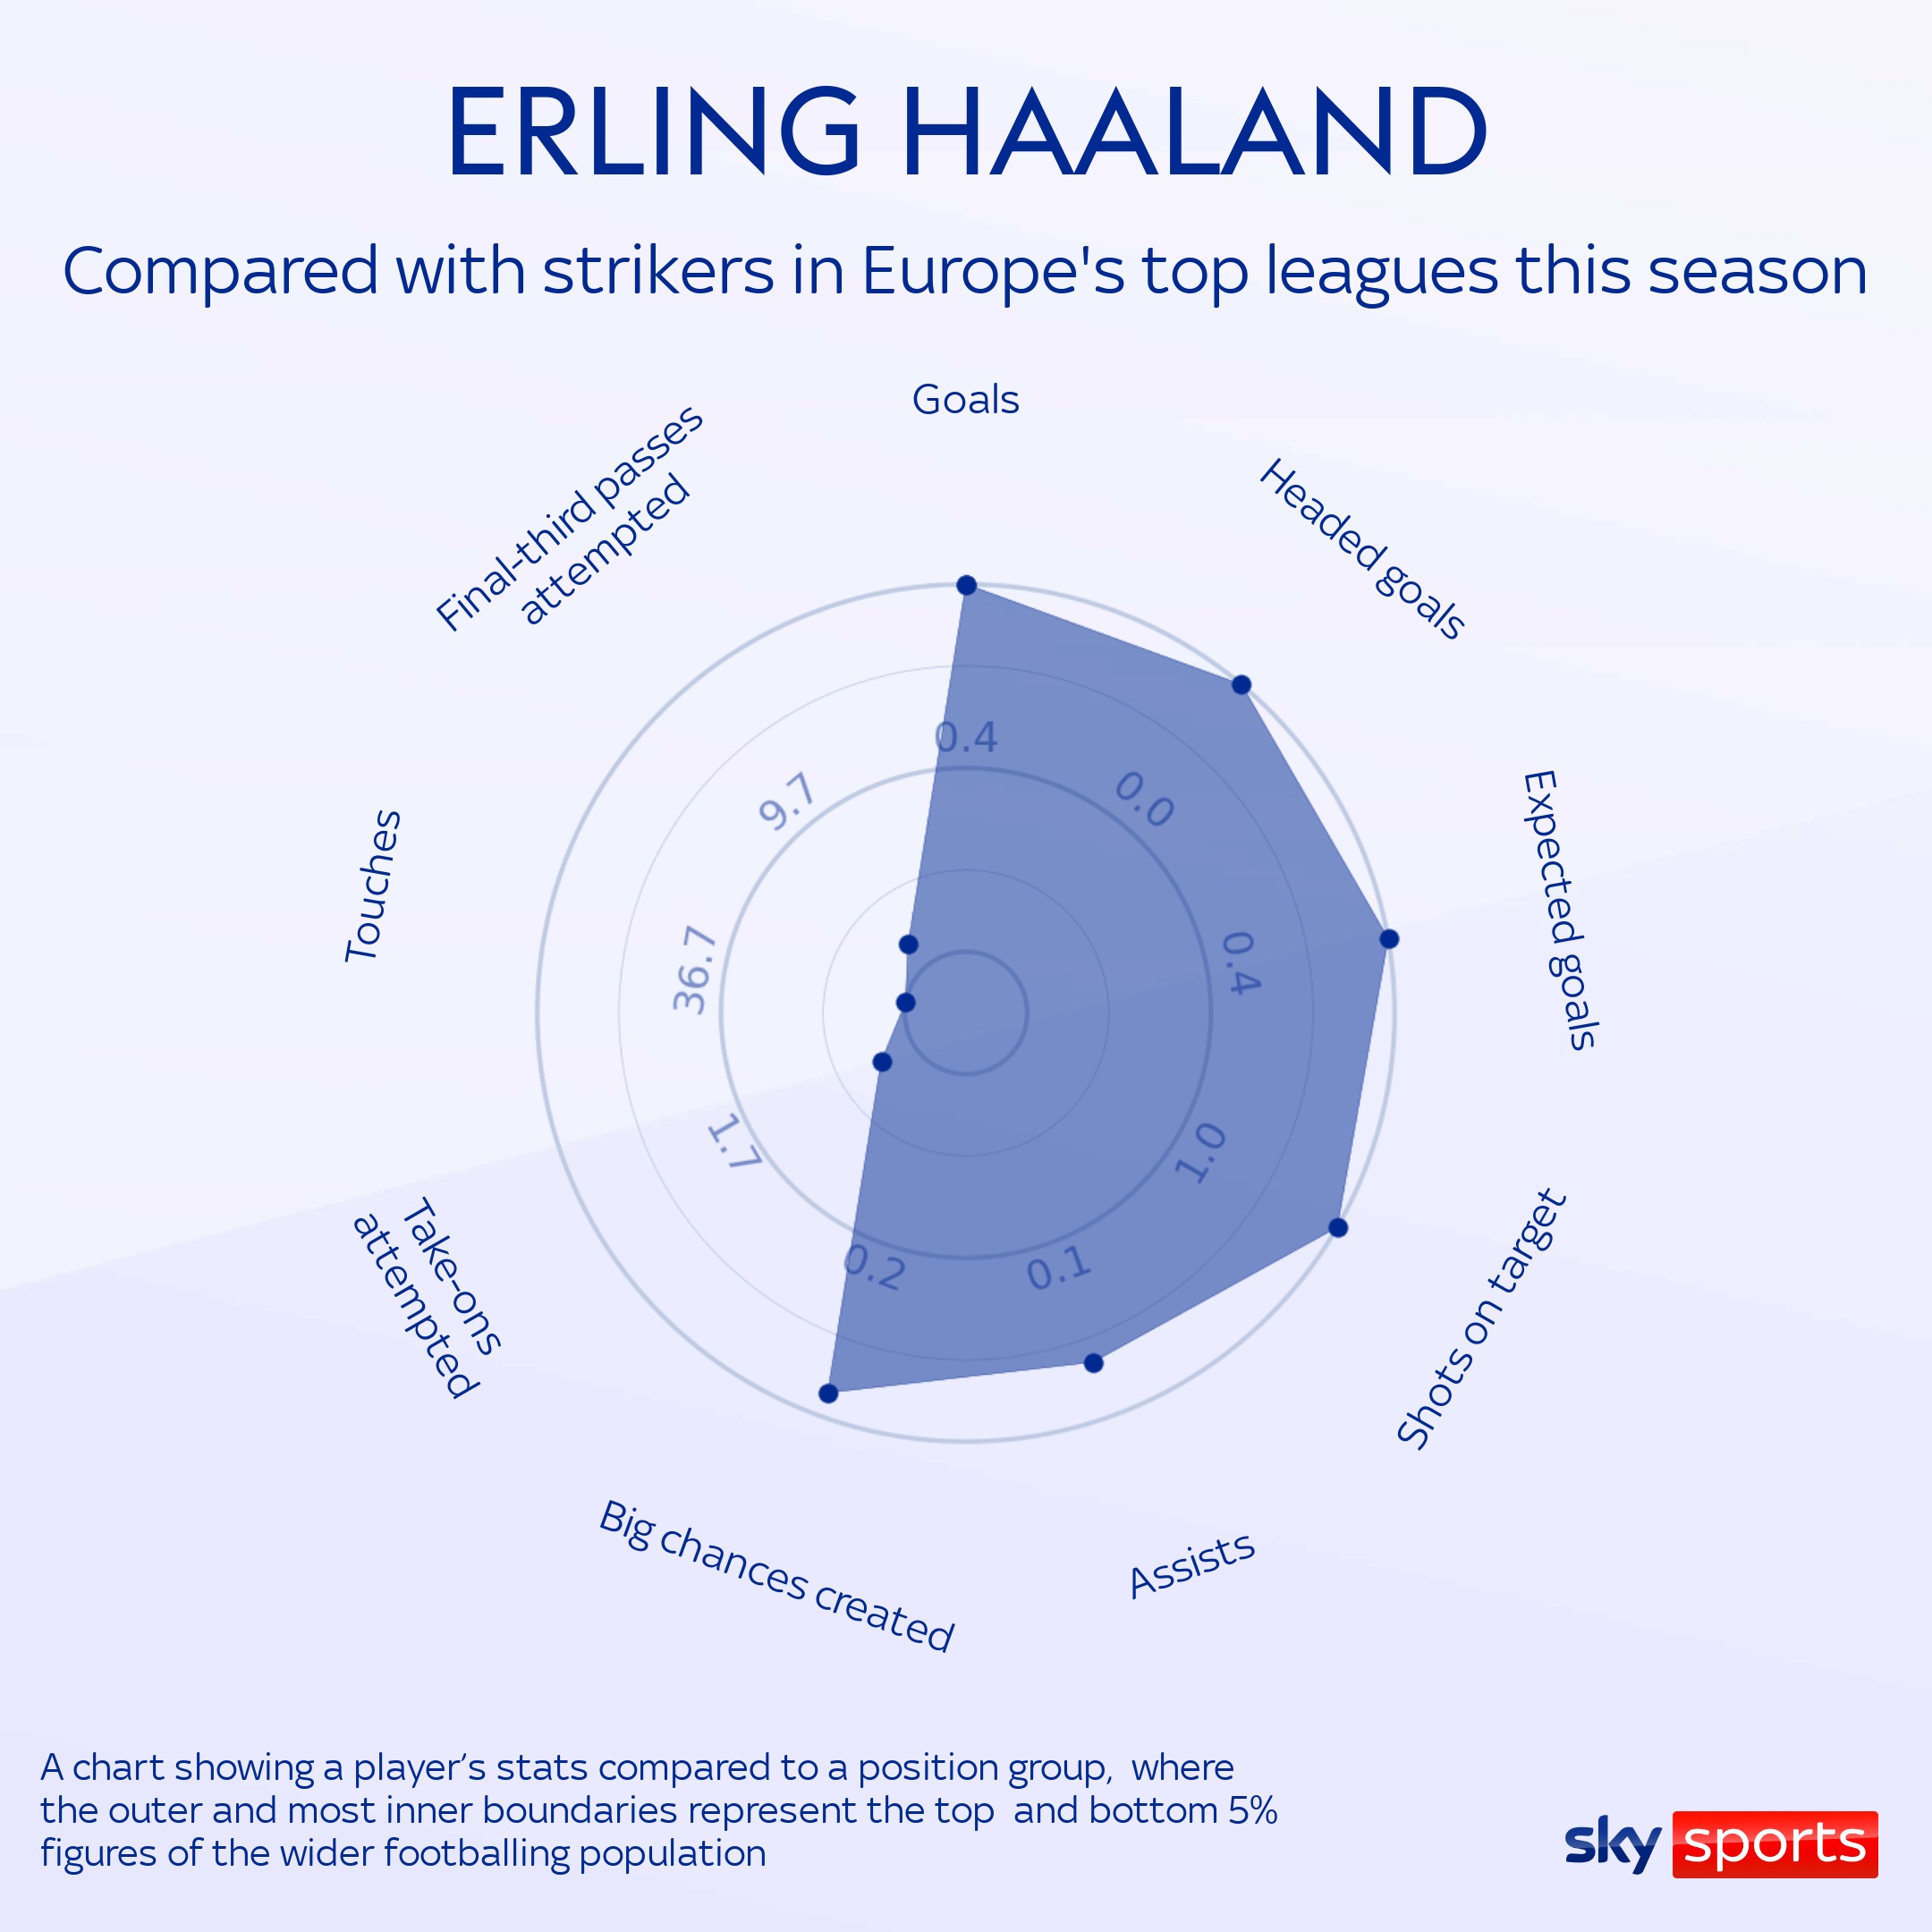
Haaland clocked merely six touches in 45 minutes against Aston Villa in February and just eight touches in 74 minutes against Bournemouth in August. Indeed, he currently averages at 22.25 touches per goal – which equates to scoring a goal in 4.5 per cent of his overall actions on the ball.

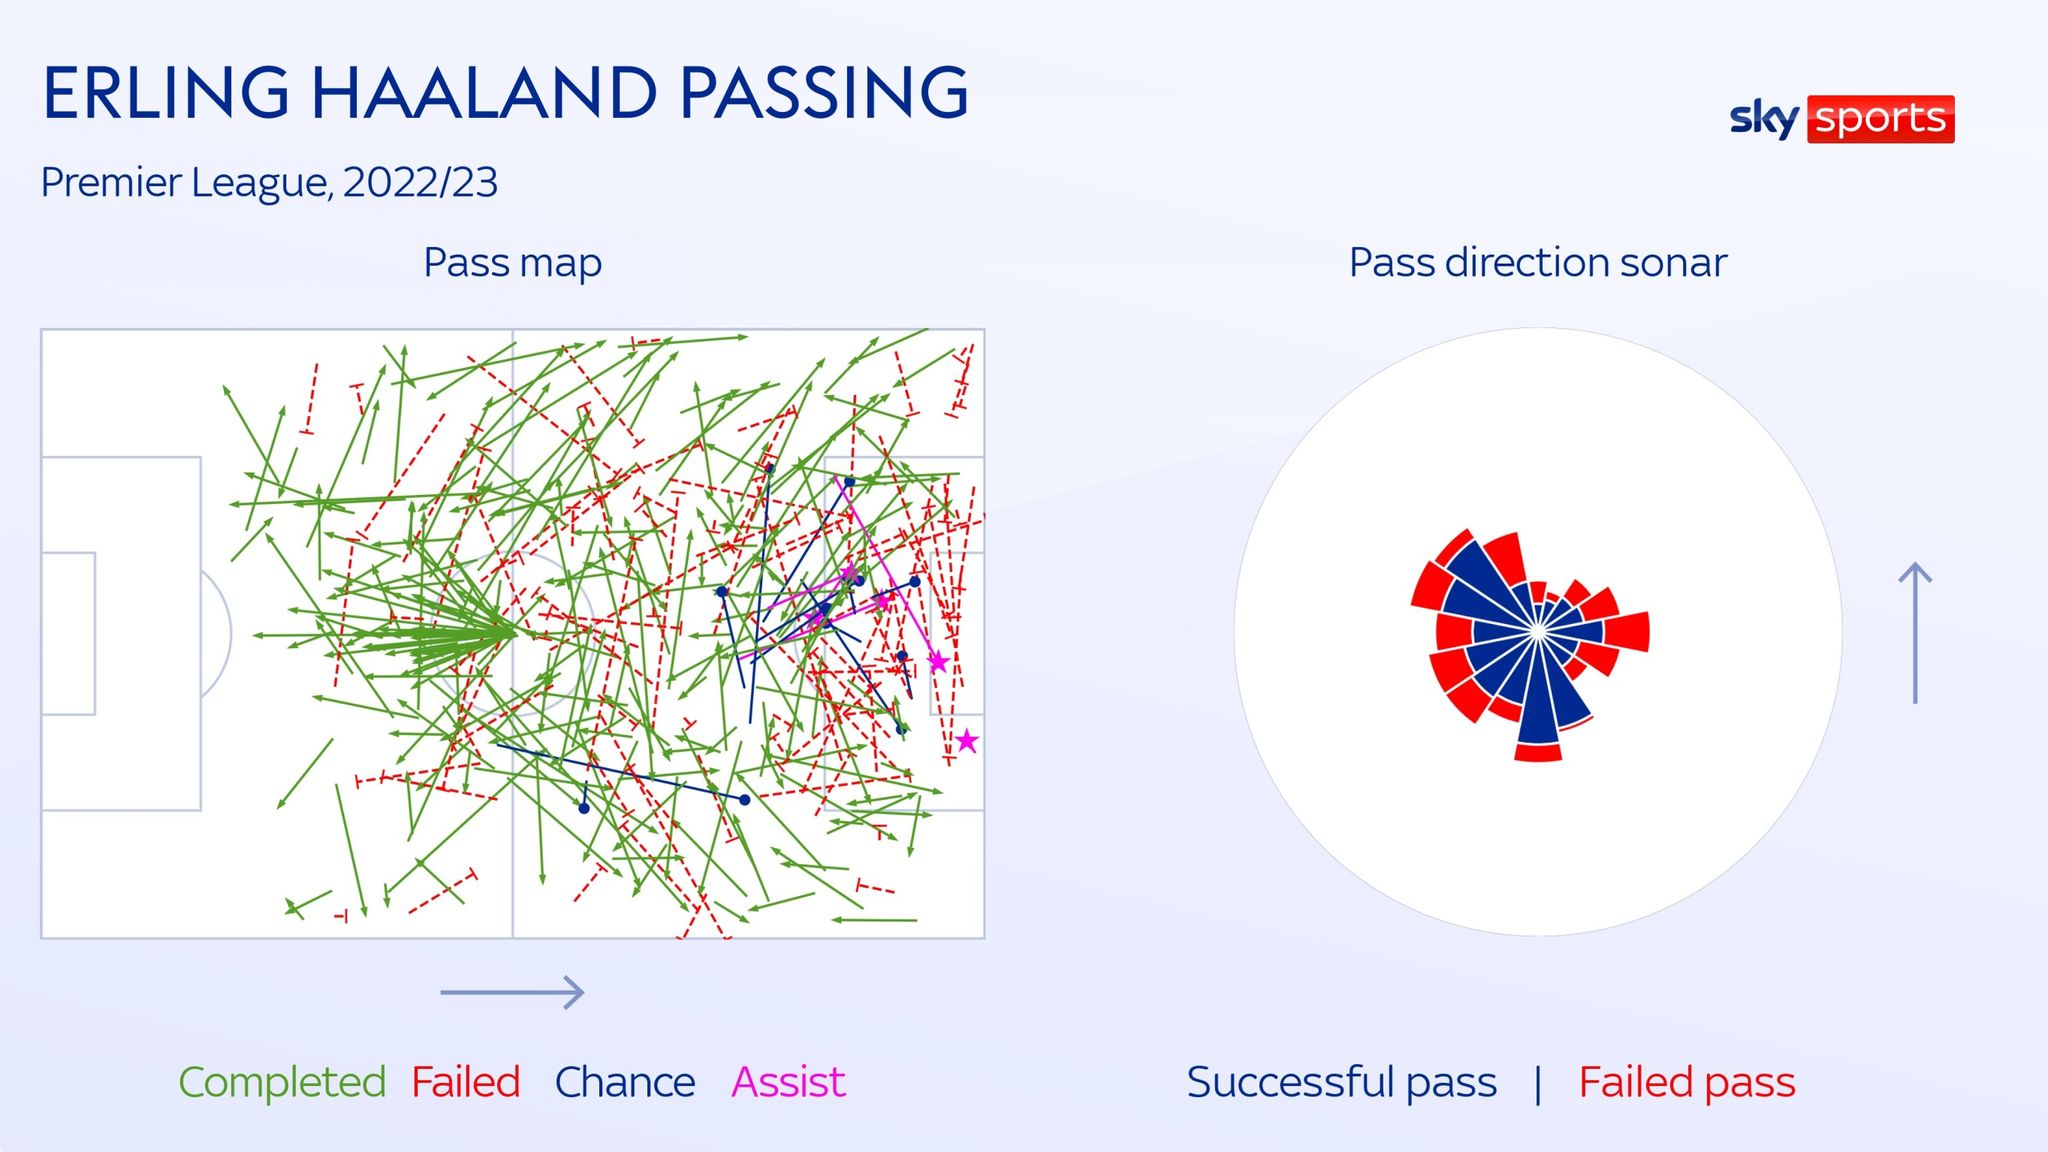
In terms of passing, Haaland tends to drift and combine with team-mates across the width of the penalty box, with a slightly higher concentration of exchanges down left-of-centre areas – while creating his most potent chances from central areas just outside the box.
Have City changed to accommodate Haaland?
Unlike Haaland’s explosive start at the Etihad, City have traditionally started seasons slowly and this season was no exception – but there are signs Guardiola’s side have tweaked their style slightly.

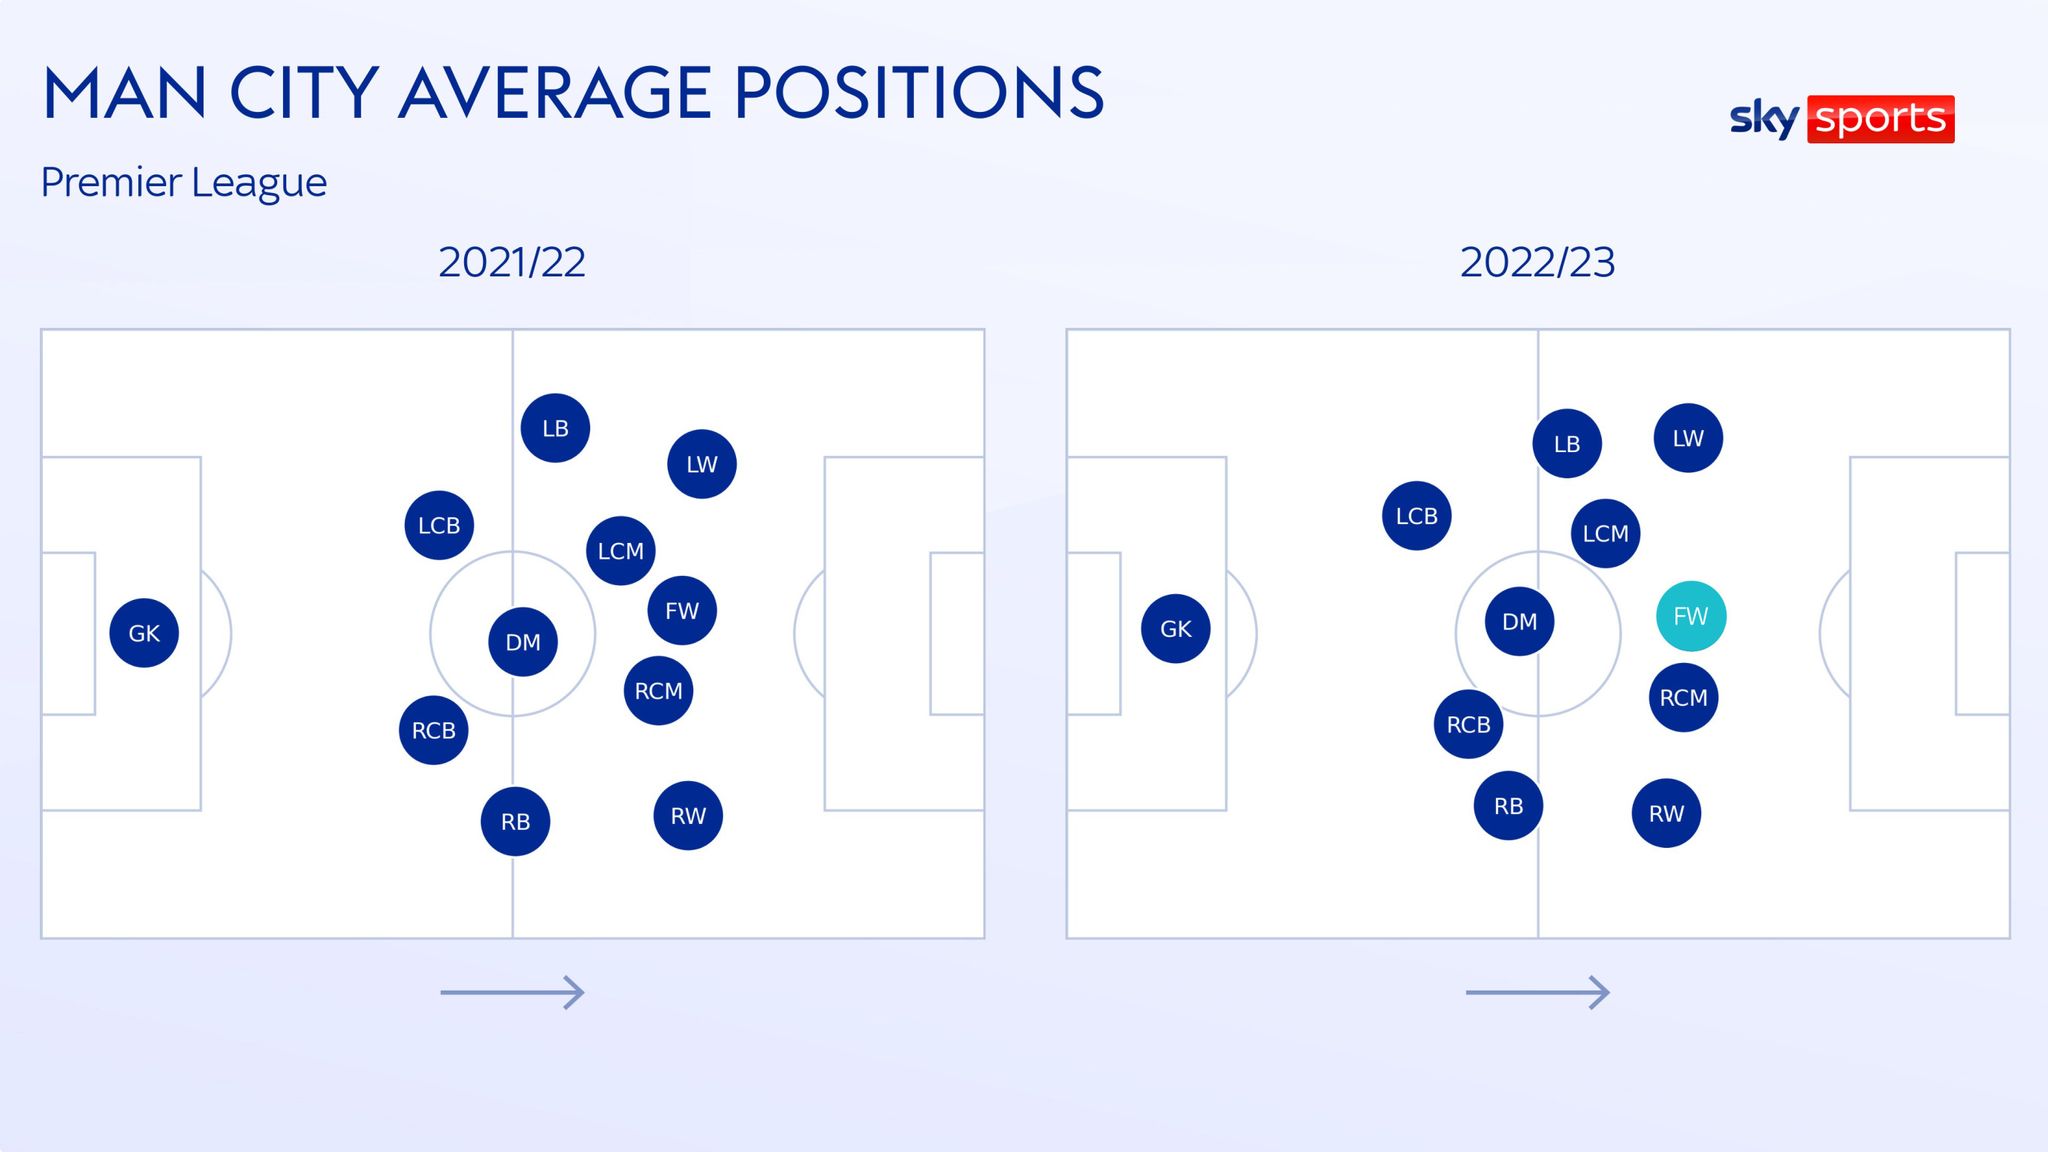
The graphic below shows how Haaland averages in a similar position to the false nine last term, although this is based on his limited touches. Meanwhile, Kevin De Bruyne has advanced upfield, the full-backs have narrowed and the left winger has pushed slightly wider.
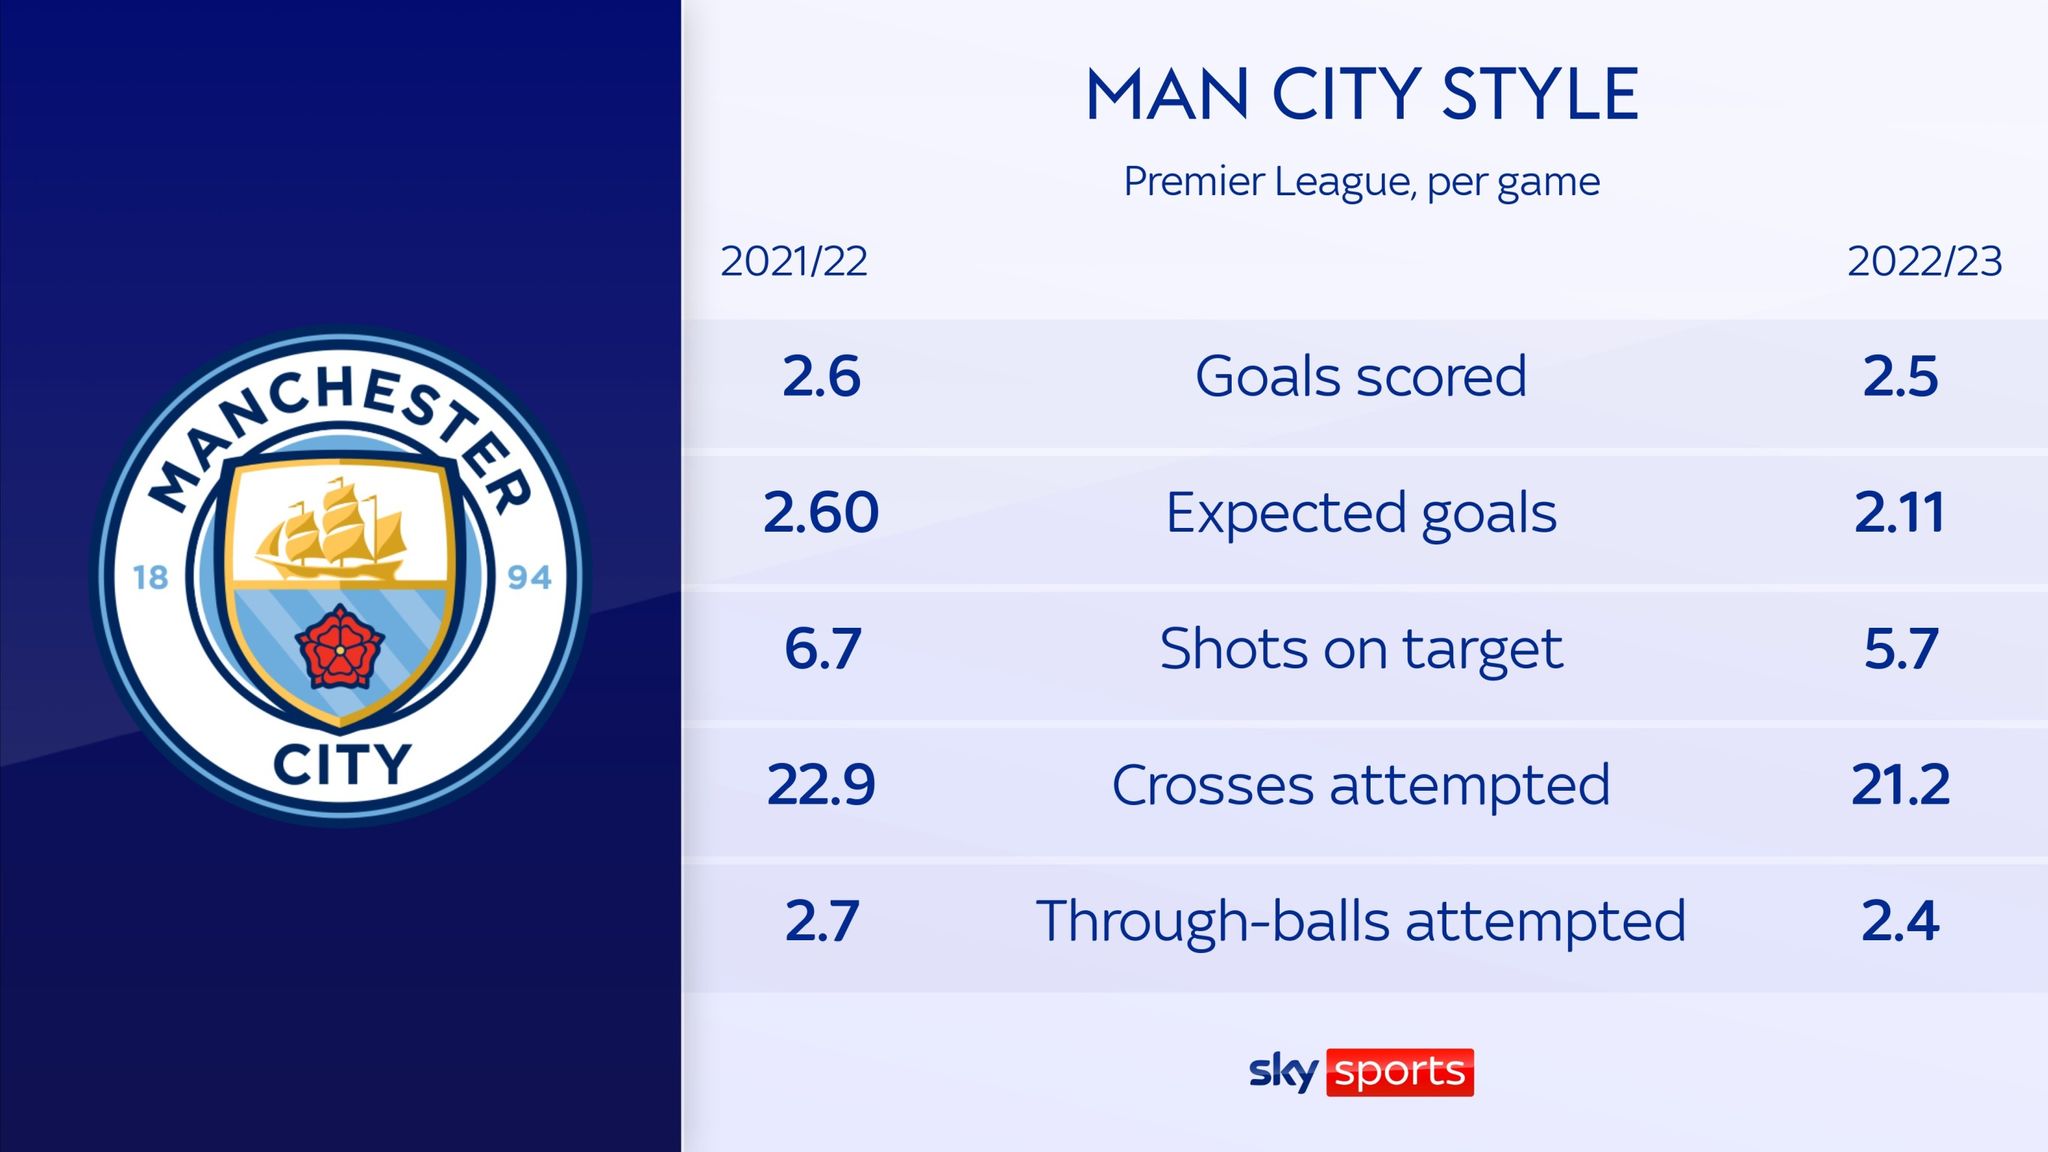
Despite Haaland’s phenomenal strike-rate, City’s output has decreased from 2.6 goals per game last season to 2.5 this term. Expected goals and shots on target are also down, which suggests team-mates are more reluctant to shoot.

Interestingly, City are also firing fewer crosses and through-balls per game this season – two metrics many might expect to increase, to accommodate and serve Haaland.
The striker’s current goal rate sets him on course to finish the season on 66 goals in all competitions – if he were to reach every final and play every minute of normal time. Unlikely… but, the Norwegian is clearly set to break more records – and there is a growing sense he will rewrite the record scales entirely.
Source: skysports.com


